vizdraws is available on cran

Page content
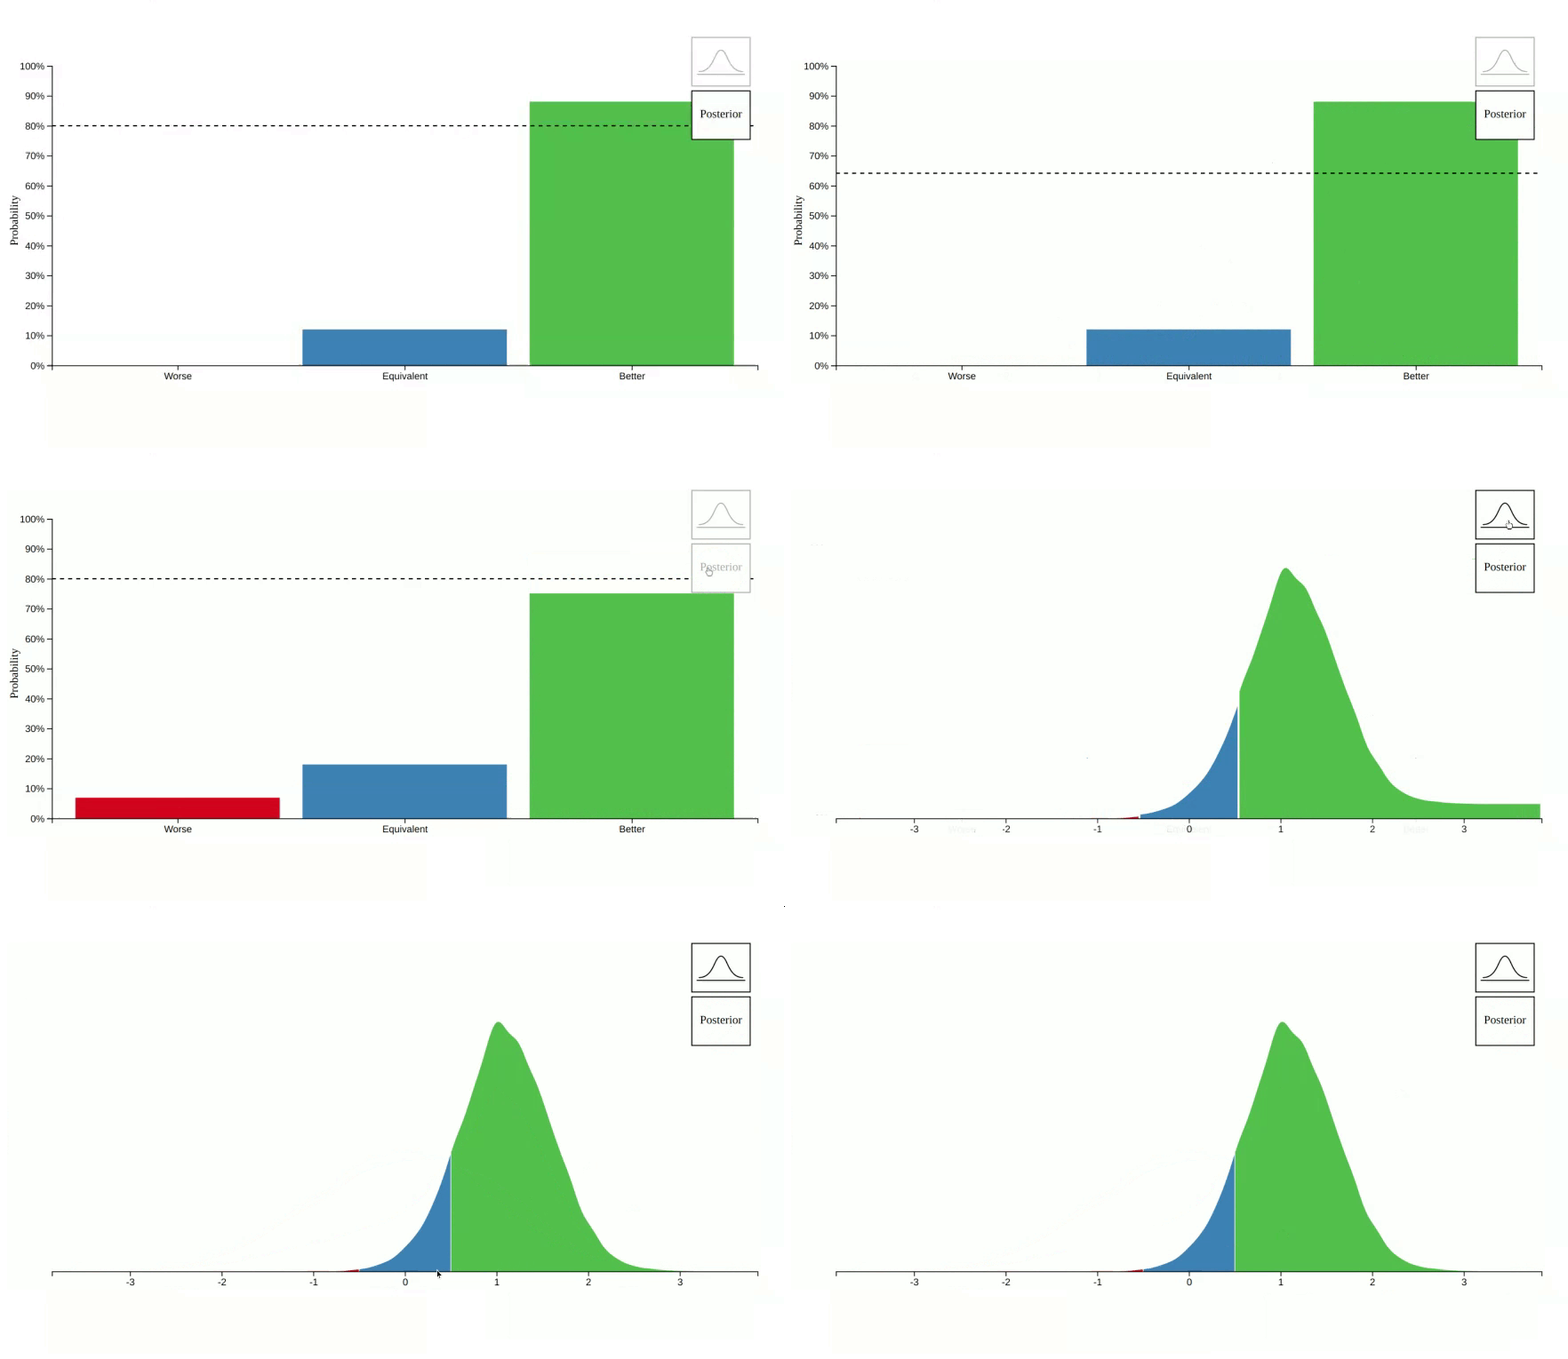
vizdraws is available on cran. The goal of this package is to help communicate findings in a better way. For example, instead of communicating a point estimate you can communicate the probability that something is better or worse that its alternative:
library(vizdraws)
vizdraws(prior = 'normal(0.05, 0.2)',
               posterior = rnorm(n = 10000, mean = 0.3, sd = 0.5))
However, in some cases 0 is not a relevant threshold for decision making. In those cases you can define a minimum meaningful effect and communicate 3 probabilities.
vizdraws(prior = "N(0,1)",
         posterior = rnorm(n = 10000, mean = 0.3, sd = 0.5),
         xlim = c(-3,3),
         MME = 0.1)
Alternatively, you can define multiple relevant buckets for making decisions:
vizdraws::vizdraws(prior = "N(0,1)",
         posterior = rnorm(n = 10000, mean = 0.6, sd = 0.45),
         breaks = c(-0.25, 0, 0.1, 0.5))
If you like the idea of this package, know D3, and want to help me do it better please reach out. I have a few ideas for features that I would like to implement.
